If you've read about the Dooty Report, you already know what shows up in your texts after every visit: a scoop count, a few observations, and a green, yellow, or red flag. The Dooty Dashboard is where every one of those reports ends up living together, visit after visit, so you can see the bigger picture instead of just the latest snapshot.
What you'll actually see
Once you're a subscriber, we text you a private link to your own dashboard. It's locked behind a personal PIN, so it's just for you and us, nobody else. Here's what that actually looks like, using a sample account we built to show you around:
This is a constructed example built from a real customers experience, with their consent and details changed to protect privacy.
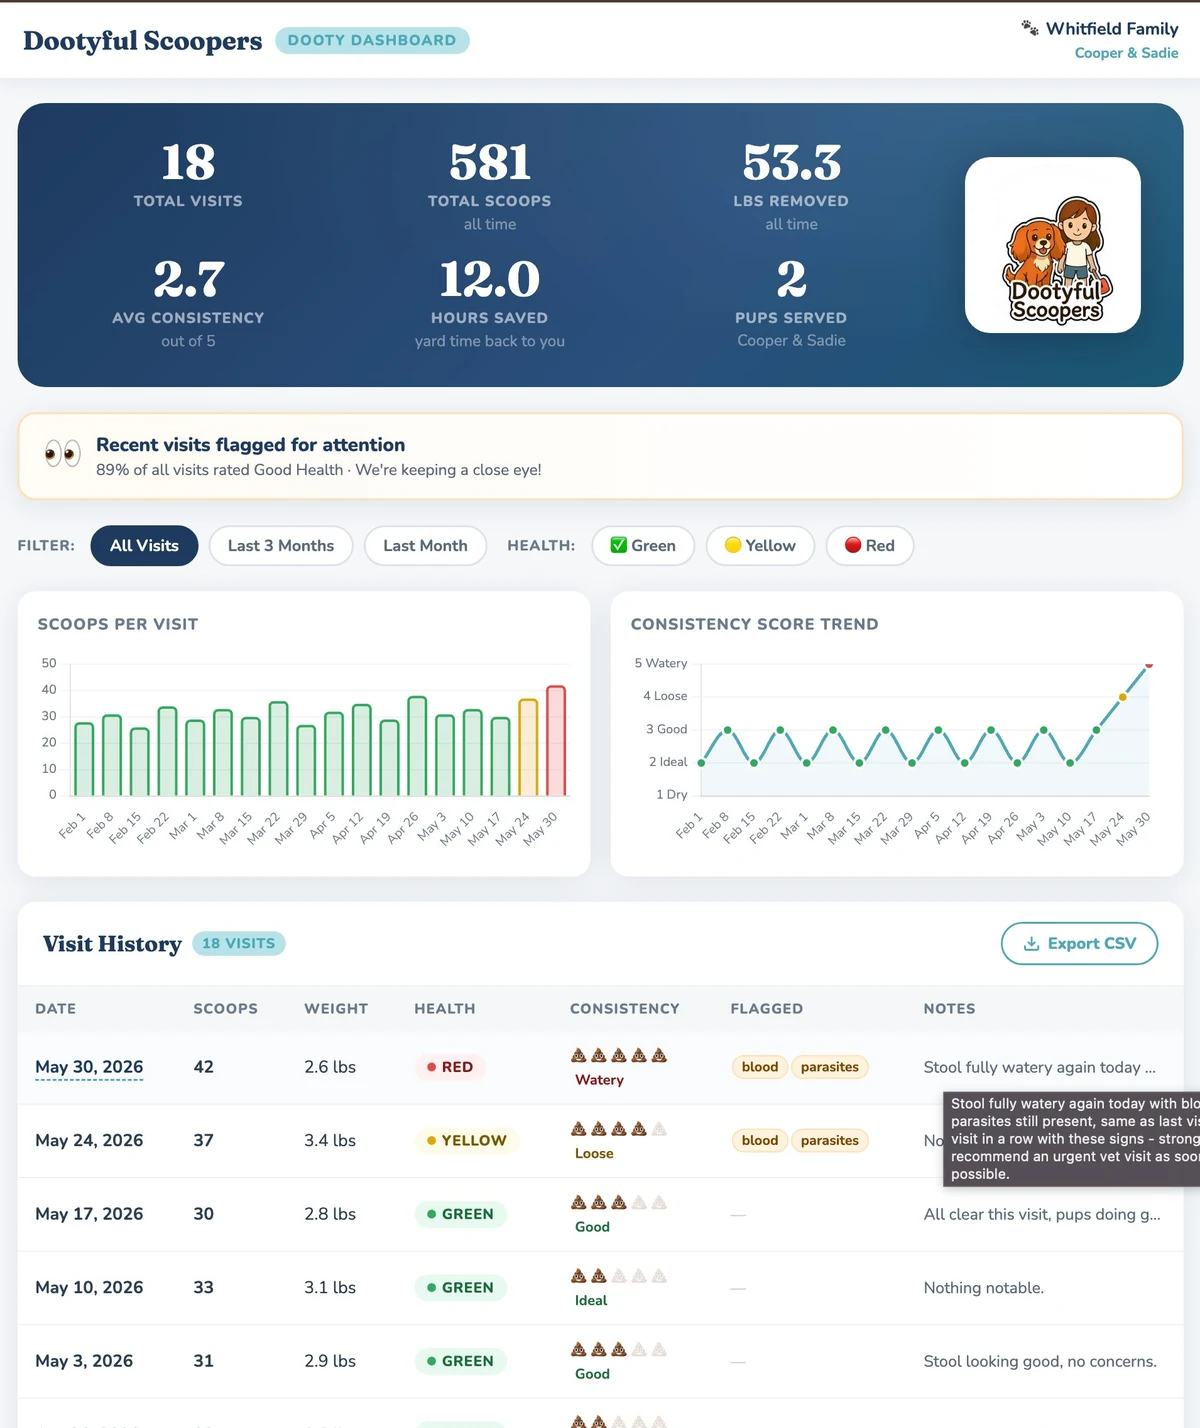
From top to bottom, you're looking at five things:
- Your stats at a glance: the six numbers across the top, explained one by one below.
- A flagged visits banner: a quick read on how things have been trending lately.
- Quick filters: narrow the view by date range or health status when you just want to check something specific.
- Two trend charts: scoop volume and stool consistency, both colored to match each visit's health flag.
- Your full visit history: the data from every report we've ever sent you, visualized and exportable. Click on the date in the visit history table to view or download all dooty reports and gate photos in one spot instead of scattered across text messages.
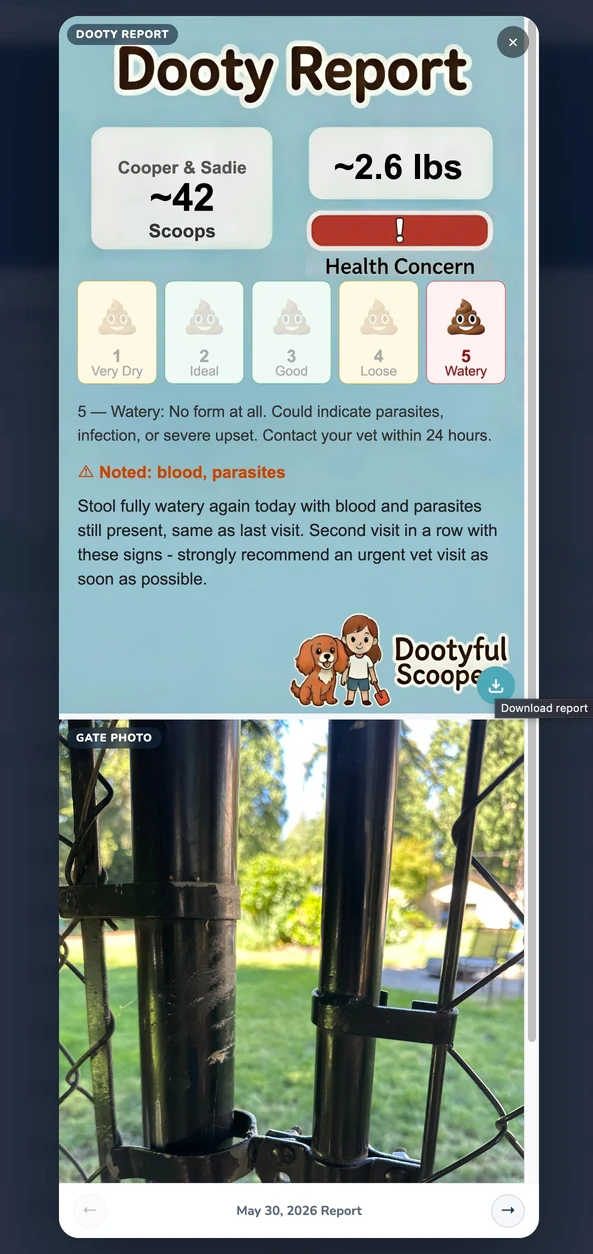
View or download all prior Dooty Reports and Gate photos from your visits in one place by clicking on the Date in the Visit History table
Your numbers, explained
The account above belongs to a two-dog household, Cooper and Sadie. Here's what each number across the top actually means, using their account to show real values instead of abstract definitions.
18 in this example. Every time we've come out and logged a report, it's counted here. More visits means a more reliable read on what's actually normal for your dog.
581 in this example. The running count of individual deposits we've collected since signup. Watched over time, it can show whether bathroom habits are holding steady.
53.3 lbs in this example. How much waste we've actually taken out of the yard. Weight per visit can shift with diet, hydration, or digestion changes even when the scoop count looks normal.
2.7 out of 5 in this example. The average of every consistency score we've logged, on a scale from 1 (dry) to 5 (watery). We're watching for sustained drift over time, not a single visit.
12 hours in this example. A rough estimate of the yard time we've handed back to you instead of you scooping it yourself.
2 in this example: Cooper and Sadie. How many dogs are on the account, so notes stay straight when more than one dog shares a yard.
Reading the two charts
Underneath your stats, two charts track the same set of visits from two different angles.
Each bar is one visit, sized by how many scoops we collected that day. The color matches that visit's health flag: green for normal, yellow for keep an eye on it, red for a concern. In the example above, the last two bars turn yellow and then red right where the pattern starts.
This line tracks stool consistency across the same visits, from 1 (dry) to 5 (watery). Cooper and Sadie sit comfortably between 2 and 3 for sixteen straight weeks, then the line climbs sharply at the very end. A sudden, sustained jump like that is exactly what this chart is built to make obvious.
When two visits in a row tell a story
A single yellow flag in a text message is easy to brush off. You read it, shrug, and move on with your day. But the same flag showing up again the following week, with the same kind of observation attached, is a different story. That's the real value of seeing reports stack up instead of living in a string of separate texts.
Here's exactly what that looked like for Cooper and Sadie. For sixteen straight weeks their reports were almost identical: green flag, consistency somewhere between 2 and 3, nothing flagged. Then, on May 24, something shifted:
One yellow flag on its own usually isn't a reason to worry. Dogs have off days, same as people. But six days later, on May 30, almost the same thing showed up again, and it had gotten worse:
Worth repeating: we're not vet techs, and nothing on this dashboard is a diagnosis. What we are is a second set of eyes in your yard every single week. When the same red flag shows up two visits in a row instead of just once, that's a pattern worth bringing to your vet, not something to wait out.
Every subscriber gets one
The Dooty Dashboard isn't a premium upgrade or an extra line item. It's included with every Dootyful Scoopers plan, from once a month to twice a week, the same way the Dooty Report itself is included with every visit.
Once you sign up, we'll text you a private, PIN-protected link to your own dashboard. It starts logging the "logs" or filling in after your very first visit and keeps building every time we come back. If you're already a subscriber and can't find your link, just text us and we'll send it right over.
We've got your yard, your dog, and the full picture.
Month-to-month plans starting at $49/mo. No contracts, no first-visit fee, and a private dashboard that tracks every Dooty Report we send. Serving Bonney Lake, Buckley, and surrounding areas.
See Plans & Get Started →